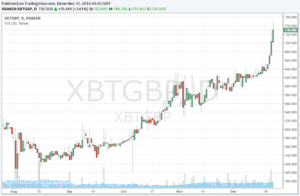
How to use our Bitcoin Chart?
Bitcoin to GBP price and historical price chart (BTC/GBP). We provide 2 types of Bitcoin Price Chart on this page, the first is a full candle-stick plotter, whilst the second is a simple daily Bitcoin price line chart. Use this link for a Bitcoin Price Ticker
Bitcoin Price Chart (BTC/GBP)
Bitcoin candle chart giving BTC prices in GBP. Click the blue button with the arrow to launch the chart in a pop-up window for expanded viewing. You will need the full screen to get the best from all the data in this chart. The chart comes from the market-leading financial charting site tradingview.com
How to use our Bitcoin Price Chart in GBP
Our Bitcoin Price Chart will allow you to follow the Bitcoin price trends in GBP Pounds Sterling.
The chart may be difficult to see on your screen so use the “open chart in pop-up” option by clicking on the blue button with the arrow in the top right corner. This will allow you to expand the Bitcoin Chart to a full-screen view.
Our Bitcoin chart is a candle chart showing the daily btc to gbp price trends.
There is a toolbar at the top of the chart that gives you options such as changing the frequency you want such as 1 minute, 1 hour, 1 day, 1 week and 1 month. The default is per day.
Use the drop-down selector to allow you to change the time interval from 1 minute to 3m, 5m, 15m, 30m, 45m. 1 hour to 2h, 3h, 4h, 1 Day, 1 week and finally 1 month.
You can change the chart type from candle chart to bars, hollow candles, Heikin Ashi, line chart, area chart, Renko, line break, Kagi, Point, and figure.
To zoom in on a shorter chart period, use your mouse roller and scroll forward, this, for example, will allow you to only see the daily rates for the past week or month.
Use the green camera icon to take a snapshot of the chart to save it or publish it to Twitter or your website.
Hover the toolbar icons to see indicators and the option to add or compare another symbol.
This Bitcoin Chart is provided free. There is a “Bitcoin Chart Pro Version” with additional features such as set alarms and trend indicators. Visit tradingview.com for more details.
Bitcoin Price Candle Chart
The candle chart gives you a lot of information but you may need some time to get familiar with everything it is telling you. Use your mouse scroll wheel to zoom into a period of interest.

bitcoin candle chart
Each candle gives you the starting price up to the high or current price for each Bitcoin trading day.
Hover your mouse over a candle on any given day to see the updated Bitcoin prices in the header bar.
This will give you for the day you have selected:
- [O] Opening Bitcoin Price
- [H] High Bitcoin Price
- [L] Low Bitcoin Price
- [C] Current Bitcoin price
There is an indicator if the price is showing in real-time or sometimes delayed.
Use our XBT to GBP currency chart for Bitcoin. BTC price graph info 24 hours, 7 day, 1 month, 3 month, 6 month, 1 year.
Prices can be denoted in BTC, USD, EUR, CNY, RUR, GBP.
